Validated against a 1,000 Hz reference. Compression and rebound speeds are computed from the full-rate trace.
Launching Nov 6–8, 2026 · Sedona Mountain Bike Festival
Your suspension, measured. Your setup optimized, decided by data.
SuspensionIQ is a mountain bike suspension data acquisition system. The system is made of up two sensors that can be quickly and easily attached to almost any frame and fork, a web app for full analysis and a mobile app that can be used in the field for suggestions of what changes should be used for your next run or for real time analysis of your last run
- 100 Hzfork + shock position sampling
- Up to 210 mmComponent travel supported
- iOS + Androidmobile plus the web app
Facts, not generic charts. Every number you see is computed based on the full-rate data your units recorded and displayed in a way to help you understand the why and how on the changes that should be made. SuspensionIQ uses that data to provide recommendations at three levels: Quick (just the changes), Standard (changes + what should come from them) and "Show your work" (detailed calculations from SuspensionIQ's engine showing the step by step process). This allows you to use your data in the way you want and get the detail you want. From "I don't care, just give me the changes" to "I want to understand the why on every change".
The system
Three components working together
01
SIQ sensor units
Fork and shocks unit that record position at 100 Hz, plus motion from an onboard IMU, to their own storage.
Sensors → 02Web app
Every ride, every run, every stroke — analysed server-side and shown as views you can read, compare, and learn from.
Web app → 03Mobile app (optional)
Check sag, start and stop the units, sync your rides, and get your next-run change while you're still on the trail.
Mobile →SIQ sensor units
Two units. Full-rate data.
The units measure shaft position directly on your fork and shock and store every sample on the unit itself. Nothing is decimated before it reaches the analysis, so the numbers you see are computed from what actually happened, not from a smoothed summary.
Three-axis acceleration and rotation recorded alongside position on each unit.
Fork unit and shock unit are paired as a set and know which role they're playing.
Compressed binary logs with integrity checks. Recordings stay on the unit until the server has them. *-Direct transfer from units available when not using mobile app
Your phone records the track, so every stroke lands on a map and every run can be split into segments. *-When mobile app is not used GPS head units can be used instead.
If a channel drops out or a file is incomplete, the recording says so. Missing data is shown as missing, never as zero.
Web app
See what your suspension actually did.
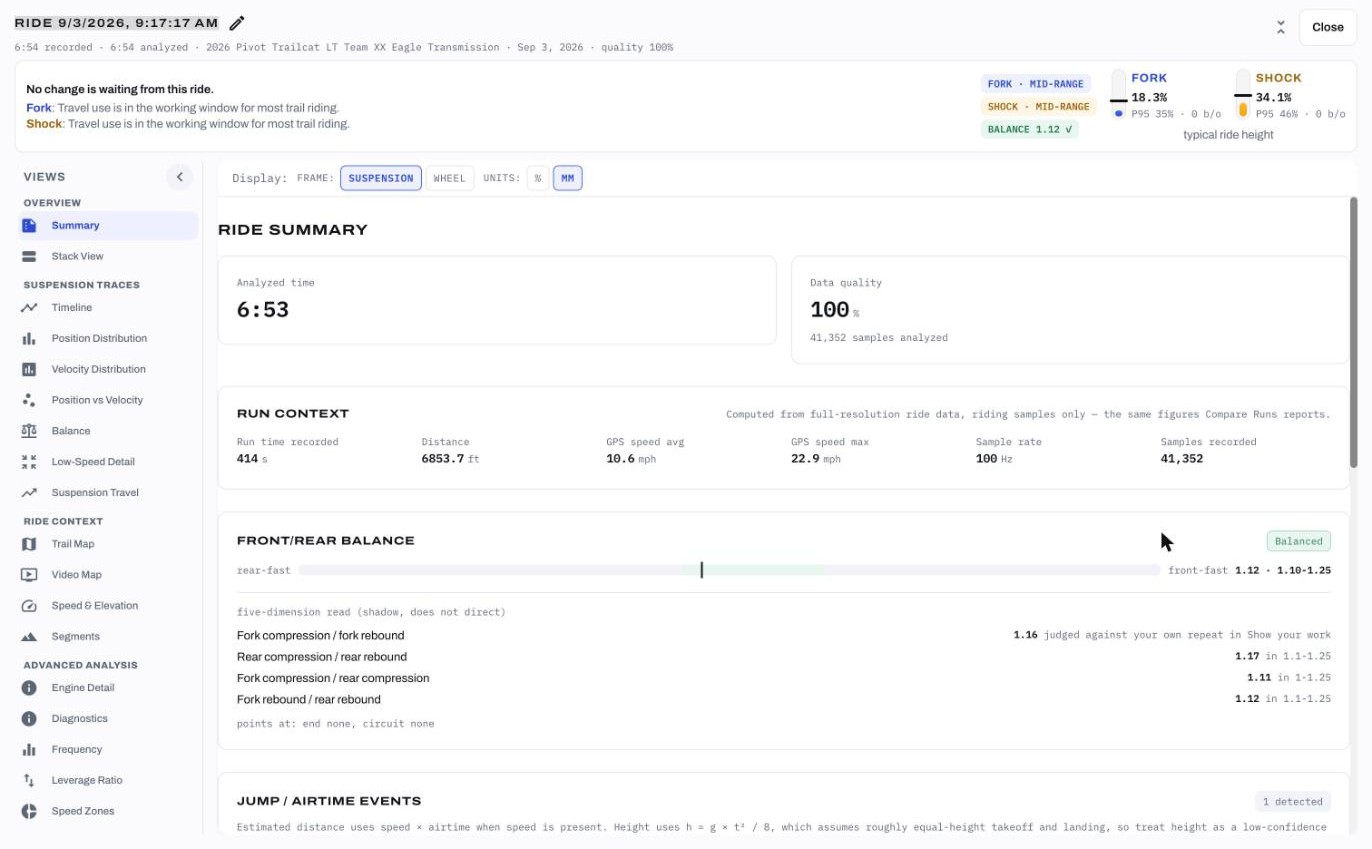
Every ride is analysed once, server-side, from the full-rate recording. The views below read from that one result, so a number on one screen always matches the same number on another.
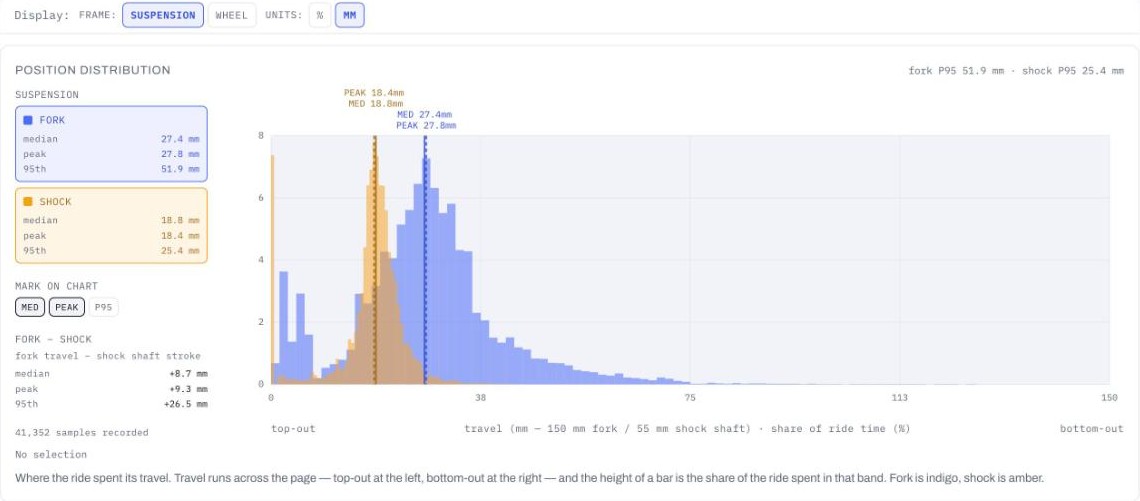
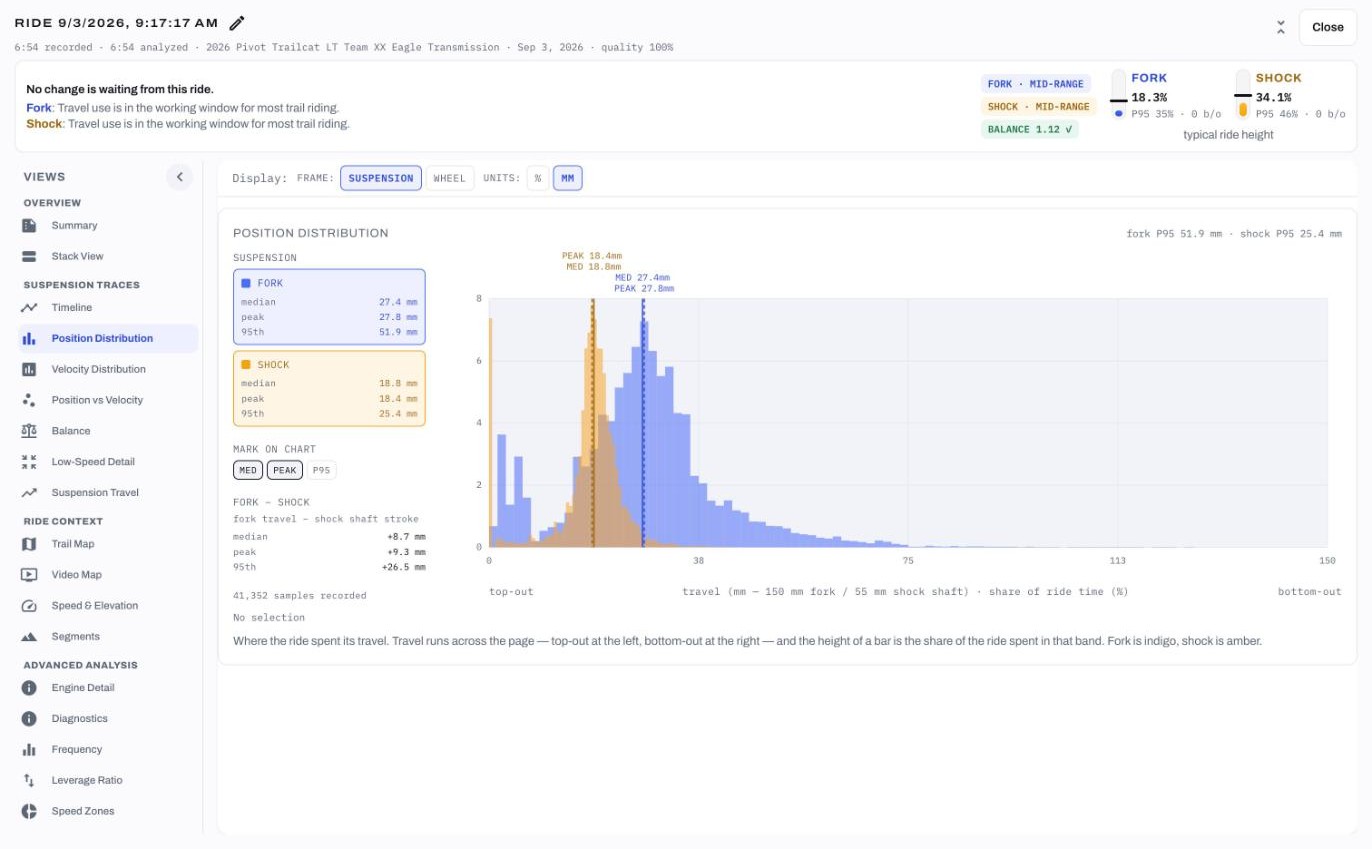
Position distribution
Where your fork and shock spend their time across the travel, overlaid so front and rear read as one system.
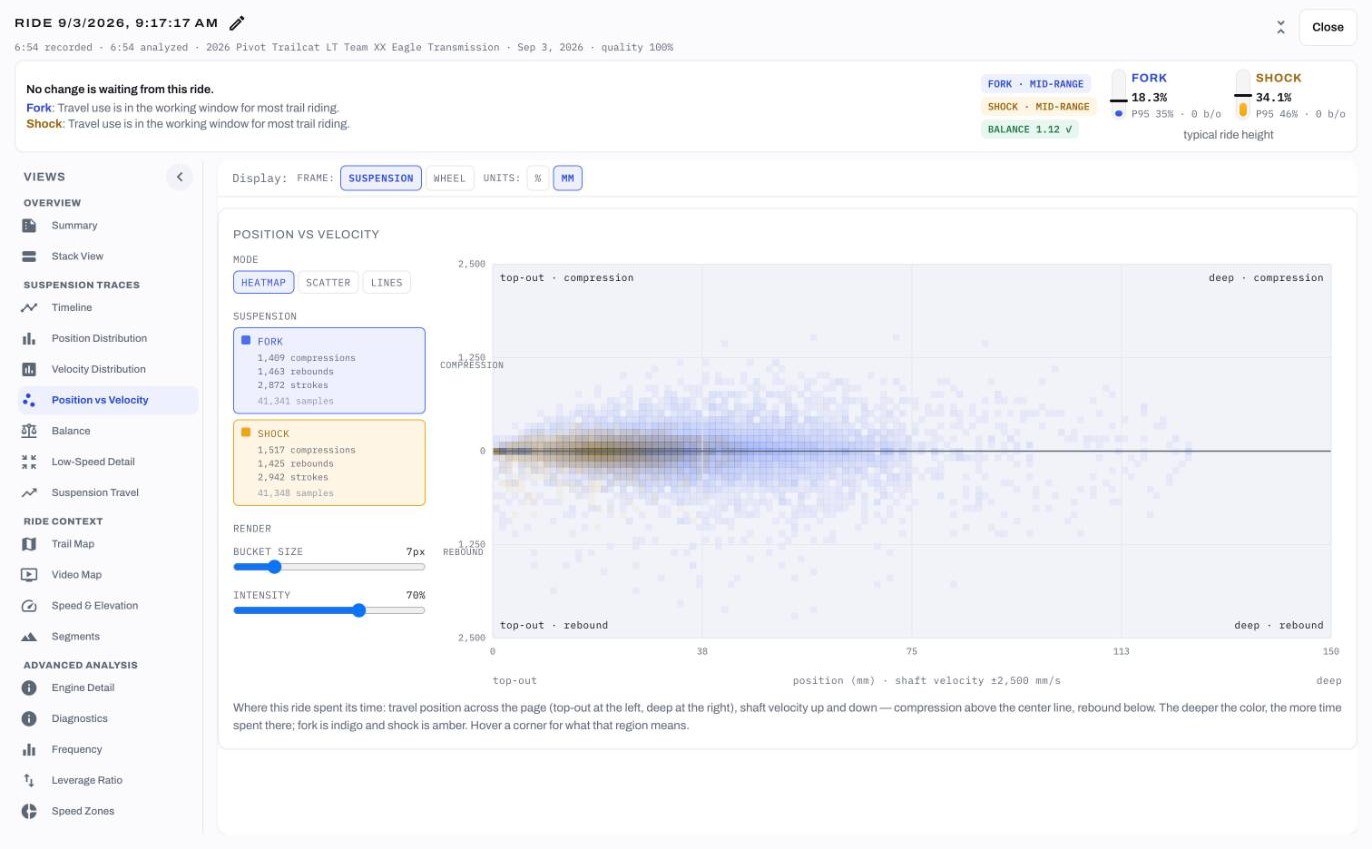
Position vs velocity
Phase portraits of every stroke: how fast the suspension moved at each point in the travel, compression and rebound side by side.
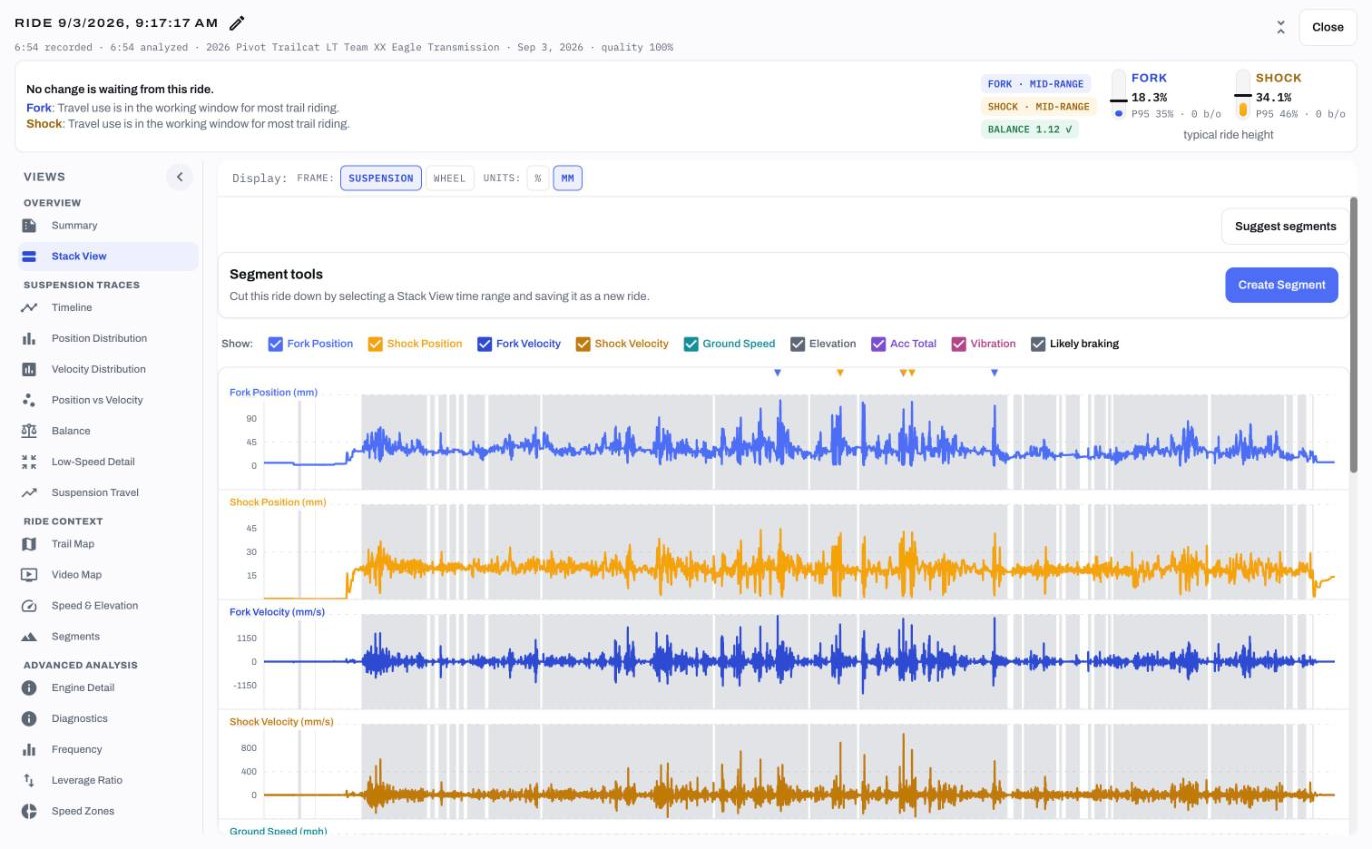
Stack view
Fork, shock, ground speed and elevation on one time axis, with per-run cards for the numbers that matter.
Speed zones & frequency
How much of the ride sat in slow versus fast shaft speeds, and the frequency content of what the trail put through the bike.
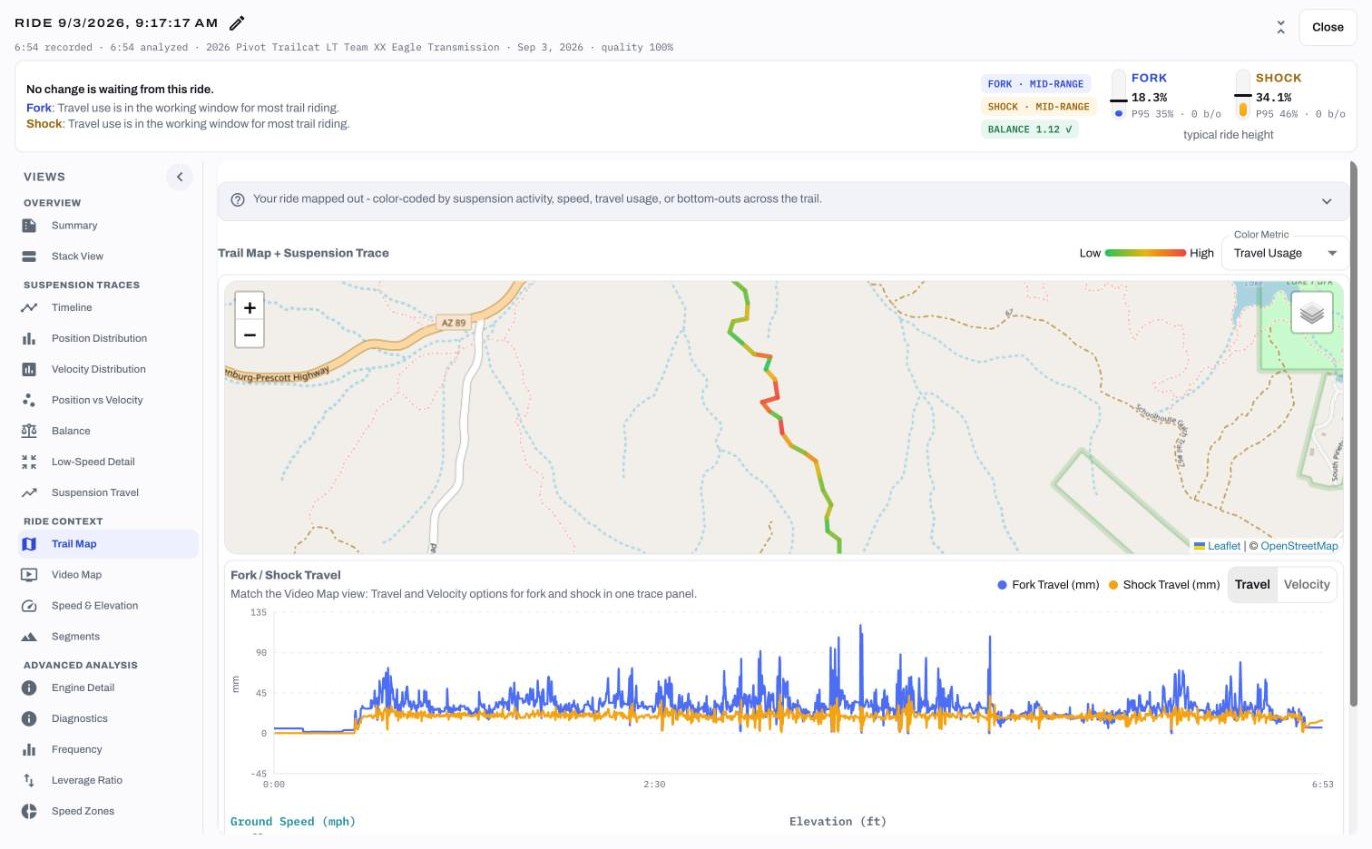
Trail map, segments & compare
Every stroke on the map. Split a ride into runs, then compare runs of the same trail across setups.
Video sync
Line up a YouTube video of the run with the ride data using your camera's GPS track. SuspensionIQ never stores your video.
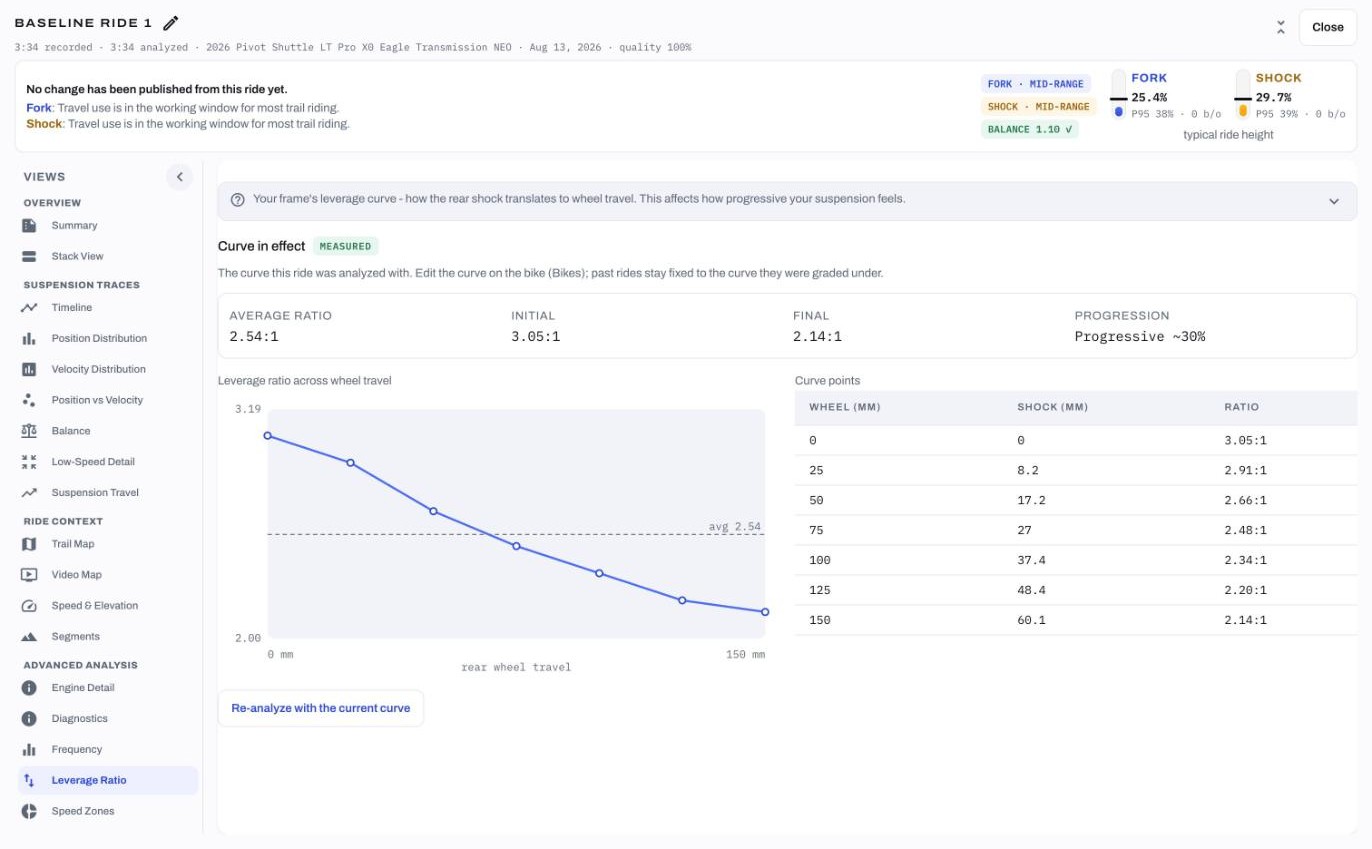
Leverage curve
Enter your frame's leverage ratio and every rear-shock number is shown at the wheel. Don't have it? The app says so and uses an estimate, labelled as one.
How to read this screen
Every view carries a plain-language explainer: what it shows, how to read it, what good looks like, and what it can't tell you.
What sets it apart
Not just charts. Tools that connect the data to the trail.
Recorded from the web app on real rides. Nothing here is a mock-up.
Video sync
Paste a YouTube link to your ride video and drop in the camera's GPX file. SuspensionIQ aligns the video to the recording from the GPS tracks, then plays the map dot, the fork and shock traces, and the video together. Click anywhere on a trace and the video jumps there. The video itself never leaves YouTube.
Stack View, live
Fork and shock position and velocity, ground speed, elevation, acceleration and vibration on one time axis. Hover for the value of every channel at that instant. Drag a range to zoom, zoom again inside it, and every card below re-computes for just that window.

Quick
Standard
Recommendations, in order, at your level of detail
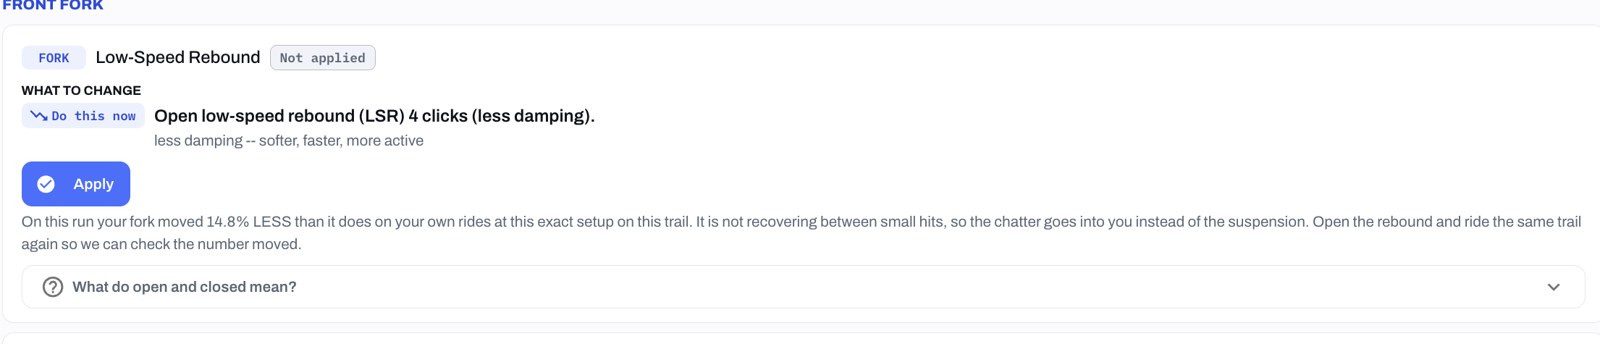
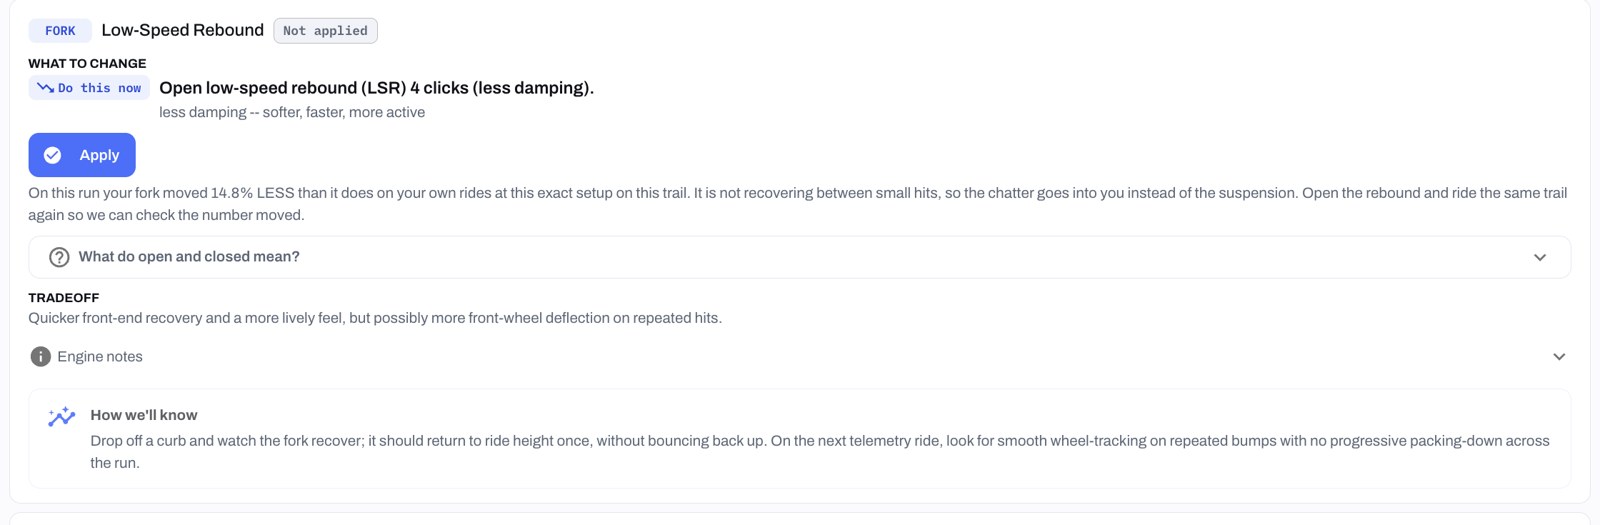
Setup is a sequence: sag and air pressure first, then rebound, then bottoming resistance, then compression. Each step unlocks when the one before it is confirmed on the bike and checked by the next ride. Every card names one change sized to a real click, the evidence behind it, and how the next ride will prove it right or wrong.
Pick how much you want to see. Quick is just the change. Standard adds the tradeoff and the verification criteria. Show your work exposes the engine's step-by-step calculation.
A/B comparison, honestly graded
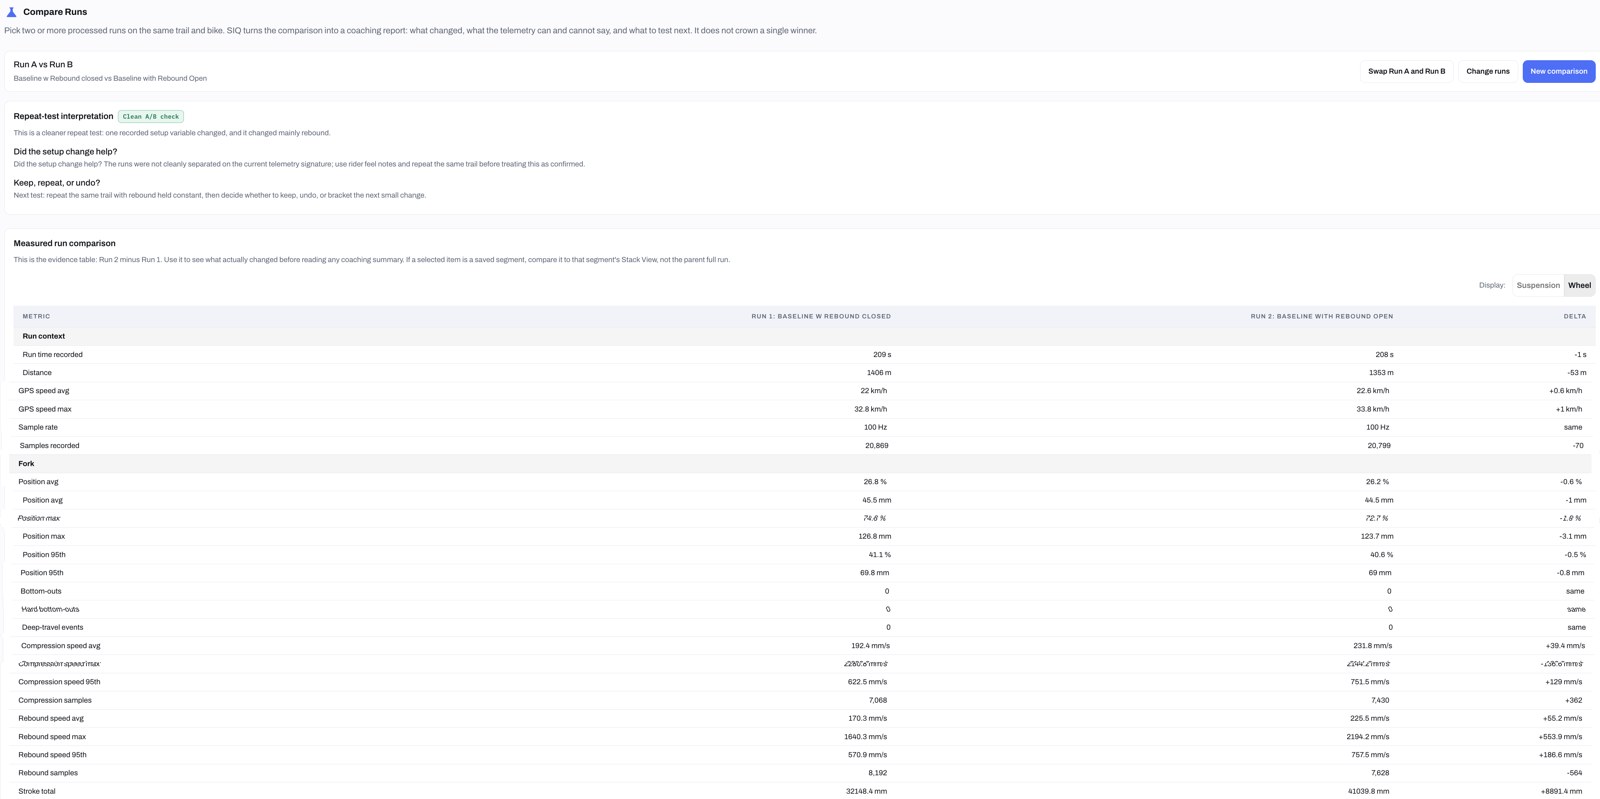
Pick two runs of the same trail and bike. SuspensionIQ first checks whether it was a clean test: did one setup variable change, and which one? Then it lays out every measured statistic for both runs with the delta, and says plainly what the telemetry can and cannot conclude. It does not crown a winner. It tells you whether to keep, undo, or bracket the next change.
Recommendations
One change. Sized to a real click. Checked on the next ride.
A recommendation is only useful if you can act on it and then find out whether it worked. So every one is quantized to an adjustment you can actually make — a whole click, a pump-able pressure step — and it tells you what to watch for on the next run.
Adjusters differ: a low-speed compression click on one damper does not do what it does on another. We always use real data and your previous rides to enhance recommendations. All values have supported numbers.
Every recommendation card is in exactly one of four states
CHANGE
The data supports a specific adjustment. Here it is, with the evidence.
SUPPORTED
Your ride supports the setting you already have. Leave it.
HOLDING ON PURPOSE
You're mid-experiment. The engine won't move a setting you're deliberately testing.
NOT ENOUGH EVIDENCE
The ride didn't contain what's needed to decide. The mobile app tells you what to ride to get it.
Mobile app · iOS and Android
The trail-side half of the system.
Available at launch on iOS and Android, the mobile app does the jobs that belong at the bike, not at a desk:
- Static sag check. Guided measurement from the units themselves — no zip tie, no o-ring.
- Start, stop, status. Control both units, see battery and storage, and know they're synced to each other before you drop in.
- Hands on the bars. Start and stop recordings with your phone's voice assistant.
- GPS from your phone. Recorded with every ride so runs land on the map automatically.
- Sync. Pull recordings off the units and up to your account. Nothing is deleted from a unit until the server confirms it has the file.
- Ride this next. When the engine needs more evidence, the app tells you what kind of run will produce it — so you spend the ride collecting the right data instead of guessing.
- Your next change, in your pocket. The current recommendation for each bike, stamped with when it was last synced, and a one-tap log when you make it.
- Works without signal. Everything you need trail-side is on the phone, unlocked with Face ID or a passcode.
How it works
Measure. Read. Change one thing. Ride again.
Set up your bike once
Pick your fork and shock from the catalog, record your current settings, and add your frame's leverage curve if you have it.
Fit the units, check sag, ride
Start the recording from your phone. The units capture at 100 Hz; the phone captures where you were.
Sync and read
Recordings go up, the engine analyses the full-rate data once, and every view in the web app reads from that result.
Make one change
The recommendation names a single adjustment sized to your hardware, or tells you honestly that it can't decide yet and what ride would settle it.
Verify on the next run
Compare runs of the same trail. The engine checks its own prediction against what happened, and keeps the misses.
The lab behind the numbers
Measured on the dyno, not assumed from the marketing.
SuspensionIQ runs its own shock dyno and spring dyno. Dampers and springs from the major manufacturers are tested click by click, so a recommendation like "two clicks of compression" is grounded in how much force that click actually adds on your damper — and that number differs a lot between products.
Shock dyno
Force–velocity behaviour of forks and shocks across their adjuster ranges, one adjuster at a time.
Spring dyno
Spring rate and progression measured directly, so "firmer" and "more progressive" are numbers, not adjectives.
Open math
The math is deliberately open. How a number is computed is never a secret, and every number carries where it came from.
Predictions kept honest
Before a change is verified, the expected outcome is recorded. Hits and misses both stay in the ledger.
Launch
Sedona Mountain Bike Festival, November 6–8, 2026.
Come ride with the units on your own bike at the SuspensionIQ booth. Both apps go live the same weekend.
Pricing and ordering details will be announced ahead of launch.
Launch list members hear first about unit availability and booth demo times.